发现了个调试PHP源码的好同志: PHP DEBUG TOOLS
其项目地址: http://freshmeat.net/projects/php-debug-tools/
文件下载地址: http://freshmeat.net/urls/7c58ae3fecce5763e7546b958d36e082
目前是1.03版本
这里偶的环境是WINDOW XP , APACHE2.2, PHP5.2+ Zend Optimizer,
这里结合PHP DEBUG TOOLS的帮助文档来讲解,图有些是摘自文档.
一.安装篇
安装前的准备环境:必须得先装X-Debug,
至于怎样安装X-Debug请看http://www.xdebug.org/docs/install
1. 从http://www.xdebug.org/download.php下载合适你的X-DEBUG版本
2. 解压DLL文件到PHP安装目录下的ext目录,如C:/php/ext/php_xdebug-2.0.4-5.2.8-nts.dll
3. 修改php.ini文件,加入下段:
-------------偶是变态的分割线,你看不见我------------------------
zend_extension = "C:/php/ext/php_xdebug-2.0.4-5.2.8-nts.dll"
xdebug.collect_includes = Off
xdebug.default_enable = Off
xdebug.dump_globals = Off
xdebug.dump_once = Off
xdebug.extended_info = Off
-------------偶是变态的分割线,你看不见我------------------------
注:This example is for non-thread safe version. For the thread safe version change "zend_extension" to "zend_extension_ts"
安装完毕,解压PHP DEBUG TOOLS压缩包里的所有文件到网站发布目录.
(假设发布目录为c:www,那么就在其新建一个debug目录,把所有文件扔进去)
在浏览器中输入:http://localhost/debug/test1-debug.php
如果看见下图则安装成功.
二.调试篇
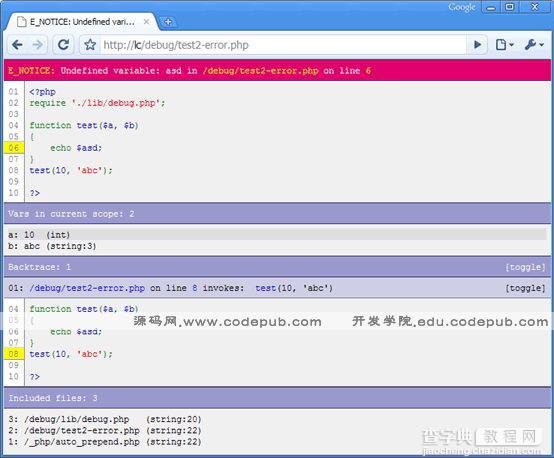
1.Debug errors
如以下代码:
复制代码 代码如下:
<?php
require './lib/debug.php';
function test($a, $b)
{
echo $asd;
}
test(10, 'abc');
?>
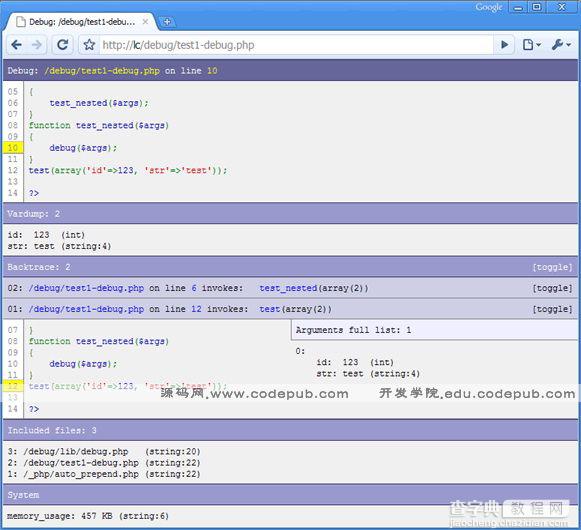
2.用Debug()来调试
如以下代码:
复制代码 代码如下:
<?php
require './lib/debug.php';
function test($args)
{
test_nested($args);
}
function test_nested($args)
{
debug($args);
// or: debug(get_defined_vars());
// or: debug();
}
test(array('id'=>123, 'str'=>'test'));
?>

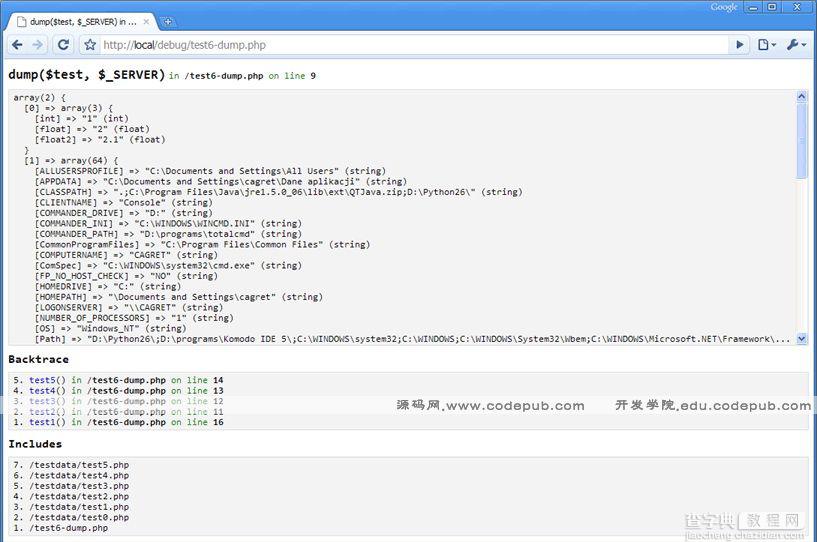
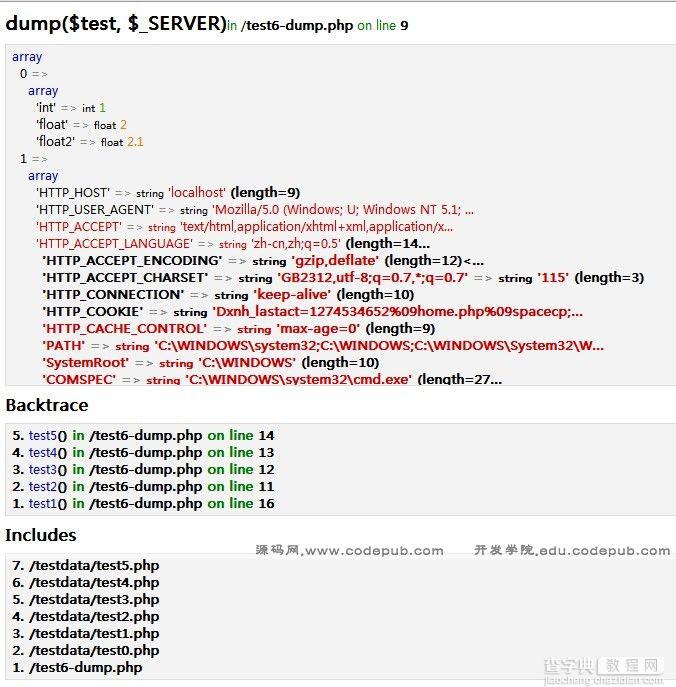
3.用dump()或者dump_tofile()调试
如以下代码:
复制代码 代码如下:
<?php
include_once './lib/dump.php';
function test5()
{
include './testdata/test0.php';
$test = array('int'=>1, 'float'=>2.0, 'float2'=>2.1);
dump($test, $_SERVER);
}
function test1() { test2(); }
function test2() { test3(); }
function test3() { test4(); }
function test4() { test5(); }
test1();
?>
至于dump_tofile()一般在以下情形使用:
A.当你不想停止程序运行时
B.不是你不想显示调式数据,而是你不能.比如当你在AJAX请求状态时.
C.你还想在多处地方调式
可参见debug目录下的test7-dump_tofile.php
注:本人在运行dump()或者dump_tofile()时发现并不能出现PHP DEBUG TOOL文档中所述
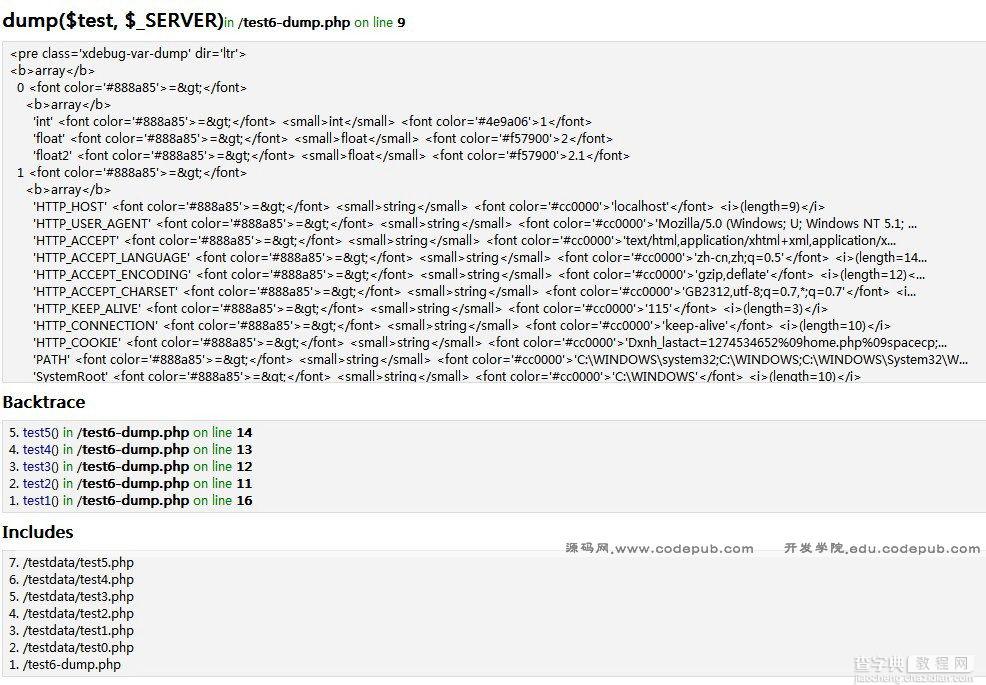
这里可以通过修改debug/lib/debug.php的代码来更正.(因为dump_tofile()有调用到dump(),所以我们只需修改一处.
于149行处的
echo $pre;
修改成:
//edit by benben---start
echo '<script type="text/javascript">';
echo 'document.write(';
echo $pre;
echo ');';
echo '</script>';
//edit by benben---end
修正后的图:
4.跟踪代码,查看系统性能
可以浏览目录下的test3-trace.php,之后点右下角的控制台就可以了.
具体可参照文档.(文档在压缩包内的doc目录下)
三,如何与项目结合?
先把php debug tool的解压缩文件,放置于项目目录,建个目录就叫debug吧! : )
其实我们需要的只是几个文件而已.
比如路径为:c:wwwprojectNamedebug
之后,我们可以通过两种方式来调试
第一种,可以在项目源码中加入这么一句:
include_once('./lib/debug.php');
例如以下:c:wwwprojectNamehellodebugindex.php
复制代码 代码如下:
<?php
include_once('./debug/lib/debug.php');
$faint = 'helloworld ,debuging';
debug($arrb);
?>
什么?你不想每个页面都写这么一句?
那么看看第二种方法,
这里也有两种方式,
1.修改php.ini 加入以下内容(修改成你自身的目录):
auto_prepend_file = "c:wwwprojectNamedebugauto_prepend.php"
auto_append_file = "c:wwwprojectNamedebugauto_append.php"
2.修改.htaccess文件(注:此方法偶没试过,嘿嘿)
php_value auto_prepend_file "c:wwwprojectNamedebugauto_prepend.php"
php_value auto_append_file "c:wwwprojectNamedebugauto_append.php"
这样的话就可以方便整个项目的调试.
如果是AJAX开发的话,还有需要的地方,具体请参照文档.(因本人还没那个需要,所以暂时先跳开了,不要拍砖,嘿嘿.)
【PHP 调试工具Debug Tools】相关文章:
★ PHP概述.
★ 全文搜索和替换