统计图形种类繁多, 有柱状图, 折线图, 扇形图等等, 而统计图形的绘制方法也有很多, 有Flash制作的统计图形, 有水晶报表生成统计图形, 有专门制图软件制作, 也有编程语言自己制作的;这里我们用就C# 制作三款最经典的统计图: 柱状图, 折线图和扇形图;既然是统计, 当然需要数据, 这里演示的数据存于Sql Server2000中, 三款统计图形都是动态生成. 其中柱状图我会附上制作步骤, 其他两款统计图直接附源码.
说明: 需求不一样, 统计图形绘制后的显示效果也不一样, 比如这里柱状图的主要需求是为了比较每一期报名人数与通过人数的差, 因此会把两根柱子放在一起会使比较结果一目了然. 因此大家可以根据需要灵活绘制.
一. 柱状图的绘制.
绘制步骤如下:
1. 定义绘图用到的类.
int height = 500, width = 700; Bitmap image = new Bitmap(width, height); Graphics g = Graphics.FromImage(image); Pen mypen = new Pen(brush, 1);
2. 绘制图框.
g.FillRectangle(Brushes.WhiteSmoke, 0, 0, width, height);
3. 绘制横向坐标线
for (int i = 0; i < 14; i++) { g.DrawLine(mypen, x, 80, x, 340); x = x + 40; }
4. 绘制纵向坐标线
for (int i = 0; i < 9; i++) { g.DrawLine(mypen, 60, y, 620, y); y = y + 26; }
5. 绘制横坐标值
String[] n = { "第一期", "第二期", "第三期", "第四期", "全年" }; for (int i = 0; i < 7; i++) { g.DrawString(n[i].ToString(), font, Brushes.Blue, x, 348); x = x + 78; }
6. 绘制纵坐标值
String[] m = {"250","225", "200", "175", "150", "125", "100“}; for (int i = 0; i < 10; i++) { g.DrawString(m[i].ToString(), font, Brushes.Blue, 25, y); y = y + 26; }
7. 定义数组存储数据库中统计的数据
int[] Count1 = new int[7]; //存储从数据库读取的报名人数 int[] Count2 = new int[7]; //存储从数据库读取的通过人数
8. 从数据库中读取报名人数与通过人数
SqlConnection Con = new SqlConnection( "Server=(Local);Database=committeeTraining;"); Con.Open(); string cmdtxt2 = "SELECT * FROM ##Count where Company='" + ****+ "'"; SqlDataAdapter da = new SqlDataAdapter(cmdtxt2, Con); DataSet ds = new DataSet(); da.Fill(ds);
9. 将读取的数据存储到数组中
Count1[0] = Convert.ToInt32(ds.Tables[0].Rows[0][“count1”].ToString()); Count1[1] = Convert.ToInt32(ds.Tables[0].Rows[0][“count3”].ToString()); Count2[0] = Convert.ToInt32(ds.Tables[0].Rows[0][“count2”].ToString()); Count2[1] = Convert.ToInt32(ds.Tables[0].Rows[0]["count4"].ToString());
10.定义画笔和画刷准备绘图
x = 80; Font font2 = new System.Drawing.Font( "Arial", 10, FontStyle.Bold); SolidBrush mybrush = new SolidBrush(Color.Red); SolidBrush mybrush2 = new SolidBrush(Color.Green);
11. 根据数组中的值绘制柱状图
(1)第一期报名人数
g.FillRectangle(mybrush, x, 340 - Count1[0], 20, Count1[0]); g.DrawString(Count1[0].ToString(), font2, Brushes.Red, x, 340 - Count1[0] - 15);
(2) 第一期通过人数
x = x + 20; g.FillRectangle(mybrush2, x, 340 - Count2[0], 20, Count2[0]); g.DrawString(Count2[0].ToString(), font2, Brushes.Green, x, 340 - Count2[0] - 15);
12. 将图形输出到页面.
System.IO.MemoryStream ms = new System.IO.MemoryStream(); image.Save(ms, System.Drawing.Imaging.ImageFormat.Jpeg); Response.ClearContent(); Response.ContentType = "image/Jpeg"; Response.BinaryWrite(ms.ToArray());
最终柱状图的效果图:
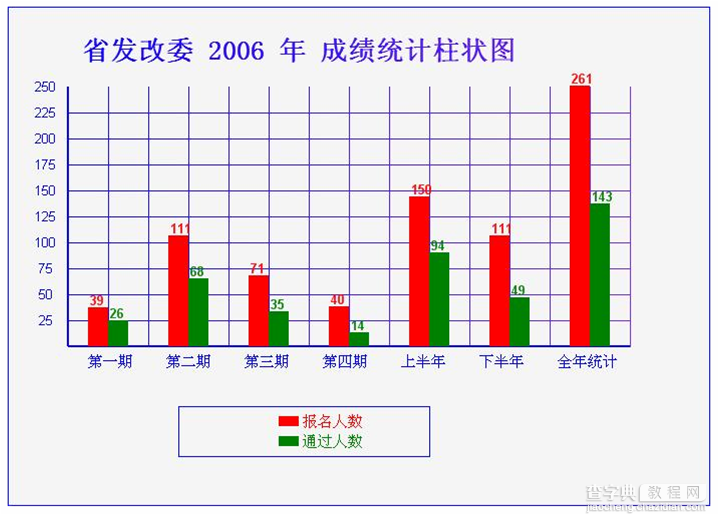
柱状图的完整代码:
private void CreateImage() { int height = 500, width = 700; Bitmap image = new Bitmap(width, height); //创建Graphics类对象 Graphics g = Graphics.FromImage(image); try { //清空图片背景色 g.Clear(Color.White); Font font = new Font("Arial", 10, FontStyle.Regular); Font font1 = new Font("宋体", 20, FontStyle.Bold); LinearGradientBrush brush = new LinearGradientBrush(new Rectangle(0, 0, image.Width, image.Height), Color.Blue, Color.BlueViolet, 1.2f, true); g.FillRectangle(Brushes.WhiteSmoke, 0, 0, width, height); // Brush brush1 = new SolidBrush(Color.Blue); g.DrawString(this.ddlTaget.SelectedItem.Text + " " + this.ddlYear.SelectedItem.Text + " 成绩统计柱状图", font1, brush, new PointF(70, 30)); //画图片的边框线 g.DrawRectangle(new Pen(Color.Blue), 0, 0, image.Width - 1, image.Height - 1); Pen mypen = new Pen(brush, 1); //绘制线条 //绘制横向线条 int x = 100; for (int i = 0; i < 14; i++) { g.DrawLine(mypen, x, 80, x, 340); x = x + 40; } Pen mypen1 = new Pen(Color.Blue, 2); x = 60; g.DrawLine(mypen1, x, 80, x, 340); //绘制纵向线条 int y = 106; for (int i = 0; i < 9; i++) { g.DrawLine(mypen, 60, y, 620, y); y = y + 26; } g.DrawLine(mypen1, 60, y, 620, y); //x轴 String[] n = { "第一期", "第二期", "第三期", "第四期", "上半年", "下半年", "全年统计" }; x = 78; for (int i = 0; i < 7; i++) { g.DrawString(n[i].ToString(), font, Brushes.Blue, x, 348); //设置文字内容及输出位置 x = x + 78; } //y轴 String[] m = {"250","225", "200", "175", "150", "125", "100", " 75", " 50", " 25", " 0"}; y = 72; for (int i = 0; i < 10; i++) { g.DrawString(m[i].ToString(), font, Brushes.Blue, 25, y); //设置文字内容及输出位置 y = y + 26; } int[] Count1 = new int[7]; int[] Count2 = new int[7]; SqlConnection Con = new SqlConnection("Server=(Local);Database=committeeTraining;Uid=sa;Pwd=**"); Con.Open(); string cmdtxt2 = "SELECT * FROM ##Count where Company='" + this.ddlTaget.SelectedItem.Text.Trim() + "'"; SqlDataAdapter da = new SqlDataAdapter(cmdtxt2, Con); DataSet ds = new DataSet(); da.Fill(ds); Count1[0] = Convert.ToInt32(ds.Tables[0].Rows[0]["count1"].ToString()); Count1[1] = Convert.ToInt32(ds.Tables[0].Rows[0]["count3"].ToString()); Count1[2] = Convert.ToInt32(ds.Tables[0].Rows[0]["count5"].ToString()); Count1[3] = Convert.ToInt32(ds.Tables[0].Rows[0]["count7"].ToString()); Count1[4] = Count1[0] + Count1[1]; Count1[5] = Count1[2] + Count1[3]; Count1[6] = Convert.ToInt32(ds.Tables[0].Rows[0]["count9"].ToString()); Count2[0] = Convert.ToInt32(ds.Tables[0].Rows[0]["count2"].ToString()); Count2[1] = Convert.ToInt32(ds.Tables[0].Rows[0]["count4"].ToString()); Count2[2] = Convert.ToInt32(ds.Tables[0].Rows[0]["count6"].ToString()); Count2[3] = Convert.ToInt32(ds.Tables[0].Rows[0]["count8"].ToString()); Count2[4] = Count2[0] + Count2[1]; Count2[5] = Count2[2] + Count2[3]; Count2[6] = Convert.ToInt32(ds.Tables[0].Rows[0]["count10"].ToString()); //绘制柱状图. x = 80; Font font2 = new System.Drawing.Font("Arial", 10, FontStyle.Bold); SolidBrush mybrush = new SolidBrush(Color.Red); SolidBrush mybrush2 = new SolidBrush(Color.Green); //第一期 g.FillRectangle(mybrush, x, 340 - Count1[0], 20, Count1[0]); g.DrawString(Count1[0].ToString(), font2, Brushes.Red, x, 340 - Count1[0] - 15); x = x + 20; g.FillRectangle(mybrush2, x, 340 - Count2[0], 20, Count2[0]); g.DrawString(Count2[0].ToString(), font2, Brushes.Green, x, 340 - Count2[0] - 15); //第二期 x = x + 60; g.FillRectangle(mybrush, x, 340 - Count1[1], 20, Count1[1]); g.DrawString(Count1[1].ToString(), font2, Brushes.Red, x, 340 - Count1[1] - 15); x = x + 20; g.FillRectangle(mybrush2, x, 340 - Count2[1], 20, Count2[1]); g.DrawString(Count2[1].ToString(), font2, Brushes.Green, x, 340 - Count2[1] - 15); //第三期 x = x + 60; g.FillRectangle(mybrush, x, 340 - Count1[2], 20, Count1[2]); g.DrawString(Count1[2].ToString(), font2, Brushes.Red, x, 340 - Count1[2] - 15); x = x + 20; g.FillRectangle(mybrush2, x, 340 - Count2[2], 20, Count2[2]); g.DrawString(Count2[2].ToString(), font2, Brushes.Green, x, 340 - Count2[2] - 15); //第四期 x = x + 60; g.FillRectangle(mybrush, x, 340 - Count1[3], 20, Count1[3]); g.DrawString(Count1[3].ToString(), font2, Brushes.Red, x, 340 - Count1[3] - 15); x = x + 20; g.FillRectangle(mybrush2, x, 340 - Count2[3], 20, Count2[3]); g.DrawString(Count2[3].ToString(), font2, Brushes.Green, x, 340 - Count2[3] - 15); //上半年 x = x + 60; g.FillRectangle(mybrush, x, 340 - Count1[4], 20, Count1[4]); g.DrawString(Count1[4].ToString(), font2, Brushes.Red, x, 340 - Count1[4] - 15); x = x + 20; g.FillRectangle(mybrush2, x, 340 - Count2[4], 20, Count2[4]); g.DrawString(Count2[4].ToString(), font2, Brushes.Green, x, 340 - Count2[4] - 15); //下半年 x = x + 60; g.FillRectangle(mybrush, x, 340 - Count1[5], 20, Count1[5]); g.DrawString(Count1[5].ToString(), font2, Brushes.Red, x, 340 - Count1[5] - 15); x = x + 20; g.FillRectangle(mybrush2, x, 340 - Count2[5], 20, Count2[5]); g.DrawString(Count2[5].ToString(), font2, Brushes.Green, x, 340 - Count2[5] - 15); //全年 x = x + 60; g.FillRectangle(mybrush, x, 340 - Count1[6], 20, Count1[6]); g.DrawString(Count1[6].ToString(), font2, Brushes.Red, x, 340 - Count1[6] - 15); x = x + 20; g.FillRectangle(mybrush2, x, 340 - Count2[6], 20, Count2[6]); g.DrawString(Count2[6].ToString(), font2, Brushes.Green, x, 340 - Count2[6] - 15); //绘制标识 Font font3 = new System.Drawing.Font("Arial", 10, FontStyle.Regular); g.DrawRectangle(new Pen(Brushes.Blue), 170, 400, 250, 50); //绘制范围框 g.FillRectangle(Brushes.Red, 270, 410, 20, 10); //绘制小矩形 g.DrawString("报名人数", font3, Brushes.Red, 292, 408); g.FillRectangle(Brushes.Green, 270, 430, 20, 10); g.DrawString("通过人数", font3, Brushes.Green, 292, 428); System.IO.MemoryStream ms = new System.IO.MemoryStream(); image.Save(ms, System.Drawing.Imaging.ImageFormat.Jpeg); Response.ClearContent(); Response.ContentType = "image/Jpeg"; Response.BinaryWrite(ms.ToArray()); } finally { g.Dispose(); image.Dispose(); } }
二. 折线统计图的绘制
效果:

折线图的完整代码:
private void CreateImage() { int height = 480, width = 700; Bitmap image = new Bitmap(width, height); Graphics g = Graphics.FromImage(image); try { //清空图片背景色 g.Clear(Color.White); Font font = new System.Drawing.Font("Arial", 9, FontStyle.Regular); Font font1 = new System.Drawing.Font("宋体", 20, FontStyle.Regular); Font font2 = new System.Drawing.Font("Arial", 8, FontStyle.Regular); LinearGradientBrush brush = new LinearGradientBrush( new Rectangle(0, 0, image.Width, image.Height), Color.Blue, Color.Blue, 1.2f, true); g.FillRectangle(Brushes.AliceBlue, 0, 0, width, height); Brush brush1 = new SolidBrush(Color.Blue); Brush brush2 = new SolidBrush(Color.SaddleBrown); g.DrawString(this.ddlTaget.SelectedItem.Text + " " + this.ddlYear.SelectedItem.Text + " 成绩统计折线图", font1, brush1, new PointF(85, 30)); //画图片的边框线 g.DrawRectangle(new Pen(Color.Blue), 0, 0, image.Width - 1, image.Height - 1); Pen mypen = new Pen(brush, 1); Pen mypen2 = new Pen(Color.Red, 2); //绘制线条 //绘制纵向线条 int x = 60; for (int i = 0; i < 8; i++) { g.DrawLine(mypen, x, 80, x, 340); x = x + 80; } Pen mypen1 = new Pen(Color.Blue, 3); x = 60; g.DrawLine(mypen1, x, 82, x, 340); //绘制横向线条 int y = 106; for (int i = 0; i < 10; i++) { g.DrawLine(mypen, 60, y, 620, y); y = y + 26; } // y = 106; g.DrawLine(mypen1, 60, y - 26, 620, y - 26); //x轴 String[] n = { "第一期", "第二期", "第三期", "第四期", "上半年", "下半年", "全年统计" }; x = 45; for (int i = 0; i < 7; i++) { g.DrawString(n[i].ToString(), font, Brushes.Red, x, 348); //设置文字内容及输出位置 x = x + 77; } //y轴 String[] m = { "220人", " 200人", " 175人", "150人", " 125人", " 100人", " 75人", " 50人", " 25人"}; y = 100; for (int i = 0; i < 9; i++) { g.DrawString(m[i].ToString(), font, Brushes.Red, 10, y); //设置文字内容及输出位置 y = y + 26; } int[] Count1 = new int[7]; int[] Count2 = new int[7]; SqlConnection Con = new SqlConnection("Server=(Local);Database=committeeTraining;Uid=sa;Pwd=eesoft"); Con.Open(); string cmdtxt2 = "SELECT * FROM ##Count where Company='" + this.ddlTaget.SelectedItem.Text.Trim() + "'"; SqlDataAdapter da = new SqlDataAdapter(cmdtxt2, Con); DataSet ds = new DataSet(); da.Fill(ds); //报名人数 Count1[0] = Convert.ToInt32(ds.Tables[0].Rows[0]["count1"].ToString()); Count1[1] = Convert.ToInt32(ds.Tables[0].Rows[0]["count3"].ToString()); Count1[2] = Convert.ToInt32(ds.Tables[0].Rows[0]["count5"].ToString()); Count1[3] = Convert.ToInt32(ds.Tables[0].Rows[0]["count7"].ToString()); Count1[6] = Convert.ToInt32(ds.Tables[0].Rows[0]["count9"].ToString()); //全年 Count1[4] = Count1[0] + Count1[1]; Count1[5] = Count1[2] + Count1[3]; Count2[0] = Convert.ToInt32(ds.Tables[0].Rows[0]["count2"].ToString()); Count2[1] = Convert.ToInt32(ds.Tables[0].Rows[0]["count4"].ToString()); Count2[2] = Convert.ToInt32(ds.Tables[0].Rows[0]["count6"].ToString()); Count2[3] = Convert.ToInt32(ds.Tables[0].Rows[0]["count8"].ToString()); Count2[6] = Convert.ToInt32(ds.Tables[0].Rows[0]["count10"].ToString()); //全年 Count2[4] = Count2[0] + Count2[1]; Count2[5] = Count2[2] + Count2[3]; //显示折线效果 Font font3 = new System.Drawing.Font("Arial", 10, FontStyle.Bold); SolidBrush mybrush = new SolidBrush(Color.Red); Point[] points1 = new Point[7]; points1[0].X = 60; points1[0].Y = 340 - Count1[0]; //从106纵坐标开始, 到(0, 0)坐标时 points1[1].X = 140; points1[1].Y = 340 - Count1[1]; points1[2].X = 220; points1[2].Y = 340 - Count1[2]; points1[3].X = 300; points1[3].Y = 340 - Count1[3]; points1[4].X = 380; points1[4].Y = 340 - Count1[4]; points1[5].X = 460; points1[5].Y = 340 - Count1[5]; points1[6].X = 540; points1[6].Y = 340 - Count1[6]; g.DrawLines(mypen2, points1); //绘制折线 //绘制数字 g.DrawString(Count1[0].ToString(), font3, Brushes.Red, 58, points1[0].Y - 20); g.DrawString(Count1[1].ToString(), font3, Brushes.Red, 138, points1[1].Y - 20); g.DrawString(Count1[2].ToString(), font3, Brushes.Red, 218, points1[2].Y - 20); g.DrawString(Count1[3].ToString(), font3, Brushes.Red, 298, points1[3].Y - 20); g.DrawString(Count1[4].ToString(), font3, Brushes.Red, 378, points1[4].Y - 20); g.DrawString(Count1[5].ToString(), font3, Brushes.Red, 458, points1[5].Y - 20); g.DrawString(Count1[6].ToString(), font3, Brushes.Red, 538, points1[6].Y - 20); Pen mypen3 = new Pen(Color.Green, 2); Point[] points2 = new Point[7]; points2[0].X = 60; points2[0].Y = 340 - Count2[0]; points2[1].X = 140; points2[1].Y = 340 - Count2[1]; points2[2].X = 220; points2[2].Y = 340 - Count2[2]; points2[3].X = 300; points2[3].Y = 340 - Count2[3]; points2[4].X = 380; points2[4].Y = 340 - Count2[4]; points2[5].X = 460; points2[5].Y = 340 - Count2[5]; points2[6].X = 540; points2[6].Y = 340 - Count2[6]; g.DrawLines(mypen3, points2); //绘制折线 //绘制通过人数 g.DrawString(Count2[0].ToString(), font3, Brushes.Green, 61, points2[0].Y - 15); g.DrawString(Count2[1].ToString(), font3, Brushes.Green, 131, points2[1].Y - 15); g.DrawString(Count2[2].ToString(), font3, Brushes.Green, 221, points2[2].Y - 15); g.DrawString(Count2[3].ToString(), font3, Brushes.Green, 301, points2[3].Y - 15); g.DrawString(Count2[4].ToString(), font3, Brushes.Green, 381, points2[4].Y - 15); g.DrawString(Count2[5].ToString(), font3, Brushes.Green, 461, points2[5].Y - 15); g.DrawString(Count2[6].ToString(), font3, Brushes.Green, 541, points2[6].Y - 15); //绘制标识 g.DrawRectangle(new Pen(Brushes.Red), 180, 390, 250, 50); //绘制范围框 g.FillRectangle(Brushes.Red, 270, 402, 20, 10); //绘制小矩形 g.DrawString("报名人数", font2, Brushes.Red, 292, 400); g.FillRectangle(Brushes.Green, 270, 422, 20, 10); g.DrawString("通过人数", font2, Brushes.Green, 292, 420); System.IO.MemoryStream ms = new System.IO.MemoryStream(); image.Save(ms, System.Drawing.Imaging.ImageFormat.Jpeg); Response.ClearContent(); Response.ContentType = "image/Jpeg"; Response.BinaryWrite(ms.ToArray()); } finally { g.Dispose(); image.Dispose(); } }
三. 扇形统计图的绘制
扇形图完整代码:
private void CreateImage() { //把连接字串指定为一个常量 SqlConnection Con = new SqlConnection("Server=(Local); Database=committeeTraining;Uid=sa;Pwd=**"); Con.Open(); string cmdtxt = selectString; // "select * from ##Count"; // //SqlCommand Com = new SqlCommand(cmdtxt, Con); DataSet ds = new DataSet(); SqlDataAdapter Da = new SqlDataAdapter(cmdtxt, Con); Da.Fill(ds); Con.Close(); float Total = 0.0f, Tmp; //转换成单精度。也可写成Convert.ToInt32 Total = Convert.ToSingle(ds.Tables[0].Rows[0][this.count[0]]); // Total=Convert.ToSingle(ds.Tables[0].Rows[0][this.count[0]]); //设置字体,fonttitle为主标题的字体 Font fontlegend = new Font("verdana", 9); Font fonttitle = new Font("verdana", 10, FontStyle.Bold); //背景宽 int width = 350; int bufferspace = 15; int legendheight = fontlegend.Height * 10 + bufferspace; //高度 int titleheight = fonttitle.Height + bufferspace; int height = width + legendheight + titleheight + bufferspace;//白色背景高 int pieheight = width; Rectangle pierect = new Rectangle(0, titleheight, width, pieheight); //加上各种随机色 ArrayList colors = new ArrayList(); Random rnd = new Random(); for (int i = 0; i < 2; i++) colors.Add(new SolidBrush(Color.FromArgb(rnd.Next(255), rnd.Next(255), rnd.Next(255)))); //创建一个bitmap实例 Bitmap objbitmap = new Bitmap(width, height); Graphics objgraphics = Graphics.FromImage(objbitmap); //画一个白色背景 objgraphics.FillRectangle(new SolidBrush(Color.White), 0, 0, width, height); //画一个亮黄色背景 objgraphics.FillRectangle(new SolidBrush(Color.Beige), pierect); //以下为画饼图(有几行row画几个) float currentdegree = 0.0f; //画通过人数 objgraphics.FillPie((SolidBrush)colors[1], pierect, currentdegree, Convert.ToSingle(ds.Tables[0].Rows[0][this.count[1]]) / Total * 360); currentdegree += Convert.ToSingle(ds.Tables[0].Rows[0][this.count[1]]) / Total * 360; //未通过人数饼状图 objgraphics.FillPie((SolidBrush)colors[0], pierect, currentdegree, ((Convert.ToSingle(ds.Tables[0].Rows[0][this.count[0]]))-(Convert.ToSingle(ds.Tables[0].Rows[0][this.count[1]]))) / Total * 360); currentdegree += ((Convert.ToSingle(ds.Tables[0].Rows[0][this.count[0]])) - (Convert.ToSingle(ds.Tables[0].Rows[0][this.count[1]]))) / Total * 360; //以下为生成主标题 SolidBrush blackbrush = new SolidBrush(Color.Black); SolidBrush bluebrush = new SolidBrush(Color.Blue); string title = " 机关单位成绩统计饼状图: " + "n nn"; StringFormat stringFormat = new StringFormat(); stringFormat.Alignment = StringAlignment.Center; stringFormat.LineAlignment = StringAlignment.Center; objgraphics.DrawString(title, fonttitle, blackbrush, new Rectangle(0, 0, width, titleheight), stringFormat); //列出各字段与得数目 objgraphics.DrawRectangle(new Pen(Color.Red, 2), 0, height + 10 - legendheight, width, legendheight + 50); objgraphics.DrawString("----------------统计信息------------------", fontlegend, bluebrush, 20, height - legendheight + fontlegend.Height * 1 + 1); objgraphics.DrawString("统计单位: " + this.ddlTaget.SelectedItem.Text, fontlegend, blackbrush, 20, height - legendheight + fontlegend.Height * 3 + 1); objgraphics.DrawString("统计年份: " + this.ddlYear.SelectedItem.Text, fontlegend, blackbrush, 20, height - legendheight + fontlegend.Height * 4 + 1); objgraphics.DrawString("统计期数: " + this.ddlSpan.SelectedItem.Text, fontlegend, blackbrush, 20, height - legendheight + fontlegend.Height * 5 + 1); objgraphics.FillRectangle((SolidBrush)colors[1], 5,height - legendheight + fontlegend.Height * 8 + 1, 10, 10); objgraphics.DrawString("报名总人数: " + Convert.ToString(Convert.ToSingle(ds.Tables[0].Rows[0][this.count[0]])), fontlegend, blackbrush, 20, height - legendheight + fontlegend.Height * 7 + 1); objgraphics.FillRectangle((SolidBrush)colors[0], 5, height - legendheight + fontlegend.Height * 9 + 1, 10, 10); objgraphics.DrawString("通过总人数: " + Convert.ToString(Convert.ToSingle(ds.Tables[0].Rows[0][this.count[1]])), fontlegend, blackbrush, 20, height - legendheight + fontlegend.Height * 8 + 1); objgraphics.DrawString("未通过人数: " + ((Convert.ToSingle(ds.Tables[0].Rows[0][this.count[0]])) - (Convert.ToSingle(ds.Tables[0].Rows[0][this.count[1]]))), fontlegend, blackbrush, 20, height - legendheight + fontlegend.Height * 9 + 1); objgraphics.DrawString("通过率: " + Convert.ToString((Convert.ToSingle(ds.Tables[0].Rows[0][this.count[1]]) / Convert.ToSingle(ds.Tables[0].Rows[0][this.count[0]])) * 100)+ " %", fontlegend, blackbrush, 20, height - legendheight + fontlegend.Height * 10 + 1); Response.ContentType = "image/Jpeg"; objbitmap.Save(Response.OutputStream, System.Drawing.Imaging.ImageFormat.Jpeg); objgraphics.Dispose(); objbitmap.Dispose(); }
这里的统计图直接输出到网页,以上就是本文的全部内容,希望对大家的学习有所帮助,也希望大家多多支持查字典教程网。
【C# 绘制统计图大全(柱状图, 折线图, 扇形图)】相关文章:
★ 基于DateTime.ParseExact方法的使用详解
★ c# 如何将RadioButton与DataTable数据进行绑定
★ c# 类型构造器
★ c# HttpWebRequest通过代理服务器抓取网页内容应用介绍